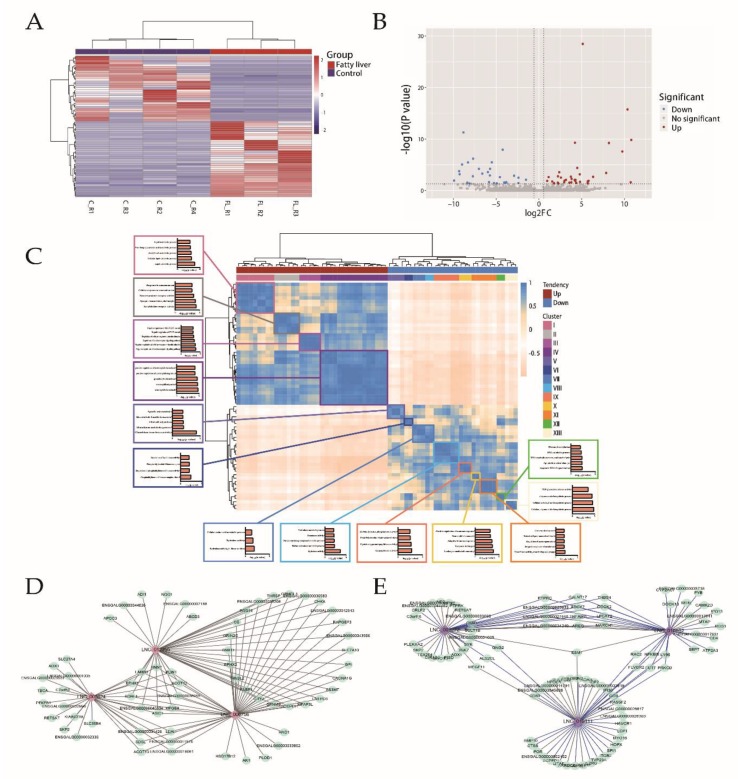
Figure 4.
Expression profile of lncRNAs and interaction between lncRNAs and DEGs. (A) Heatmap of differentially expressed lncRNAs via hierarchical cluster analysis. Red and blue strips represent up- and downregulation, respectively. (B) Volcano plot revealing differentially expressed lncRNAs with various adjusted p-values and FC. Vertical line, FC = 1.5; horizontal line, adjusted p-value = 0.05. Red points, upregulated lncRNAs; blue points, downregulated lncRNAs. (C) Gene Ontology (GO) annotation with target DEGs of lncRNAs from each cluster. Boxes with various colors represent 13 clusters of lncRNAs. (D) Co-expression network between DEGs and lipid-related long noncoding RNAs (lncRNAs). The diamonds with various colors represent different clusters of lncRNAs, the circles with light green represent co-expression DEGs; grey line means the positive correlation between lncRNAs and DEGs, while blue line means the negative correlation between lncRNAs and DEGs. (E) Co-expression network between DEGs and immune-related lncRNAs.

