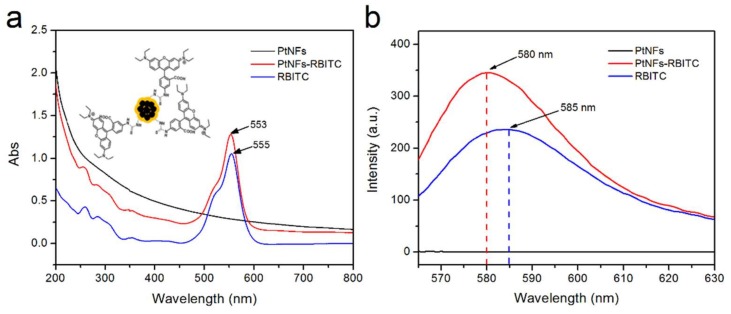
Figure 6.
(a) UV-Vis absorbance spectra of Pt NFs (black spectrum), Rhodamine B Isothiocyanate (RBITC) labeled Pt NFs (Red spectrum), free RhB-ITC (blue spectrum). Insert shows the schematic illustration of RBITC labeled Pt NFs. (b) Fluorescence emission spectra (λexc = 555 nm) of Pt NFs, RBITC labeled Pt NFs, RBITC.

