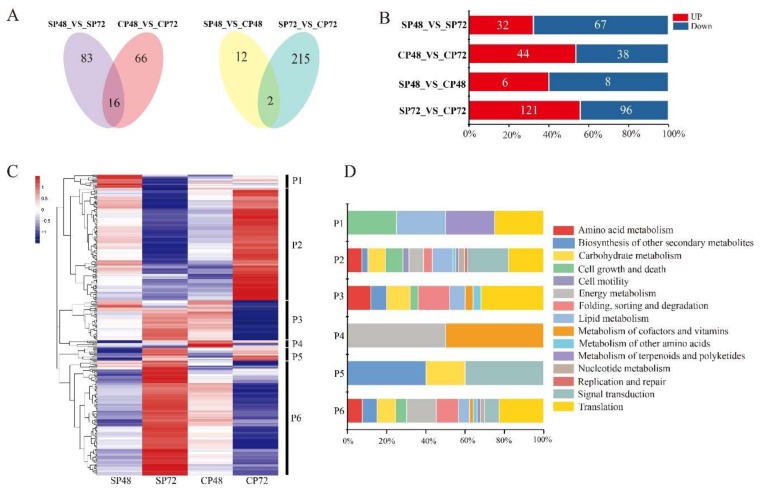
Figure 6.
Differentially expressed proteins (DEPs) analysis of C. oleifera after self- and cross-pollination. (A) Venn diagrams of DEPs in self- and cross-pollinated pistils at 48 and 72 hours. SP48/72, self-pollinated pistils at 48 h/72 h and CP48/72, cross-pollinated pistils at 48 h/72 h. (B) Numbers of DEPs in self- and cross-pollinated pistils. (C) Hierarchical clustering analysis of 295 DEPs after self- and cross-pollination of C. oleifera. DEPs clustered into six groups (P1–P6). (D) Stacked bar chart of classification of KEGG pathway in six groups. The X-axis represents the proportion of each class in the corresponding cluster.

