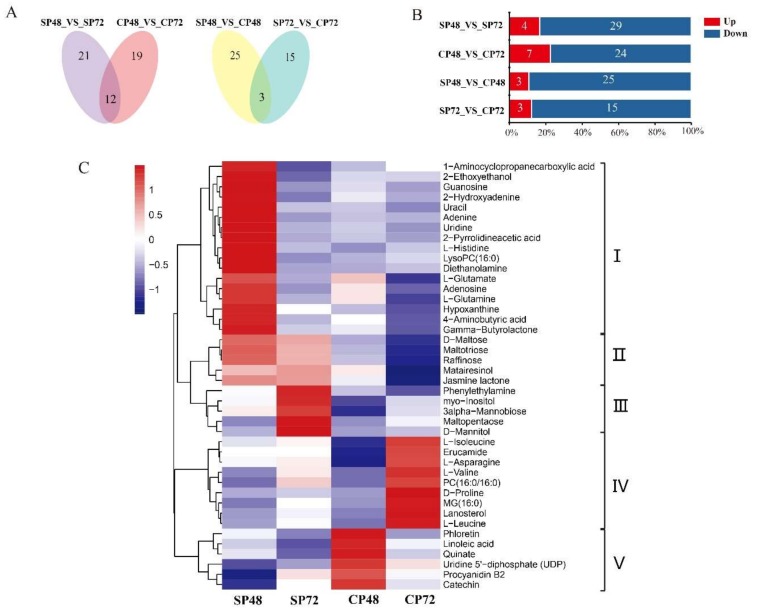
Figure 7.
Differentially expressed metabolites (DEMs) analysis of C. oleifera after self- and cross-pollination. (A) Venn diagrams of DEMs in self- and cross-pollinated pistils at 48 and 72 h. (B) Numbers of DEMs in self- and cross-pollinated pistils. (C) Hierarchical clustering analysis of DEMs after self- and cross-pollination of C. oleifera. SP48/72, self-pollinated pistils at 48 h/72 h and CP48/72, cross-pollinated pistils at 48 h/72 h.

