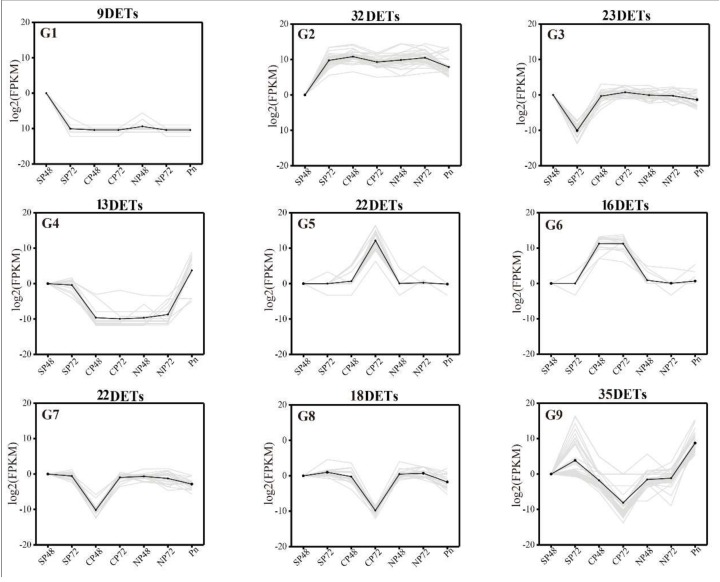
Figure 8.
Trend analysis of differentially expressed genes showing the transcriptome expression profiles. Nine clusters were identified. SP48/72, self-pollinated pistils at 48 h/72 h; CP48/72, cross-pollinated pistils at 48 h/72 h; NP48/72, non-pollinated pistils at 48 h/72 h and Pn, mature pollen. FPKM = fragments per kilobase per million mapped fragments.

