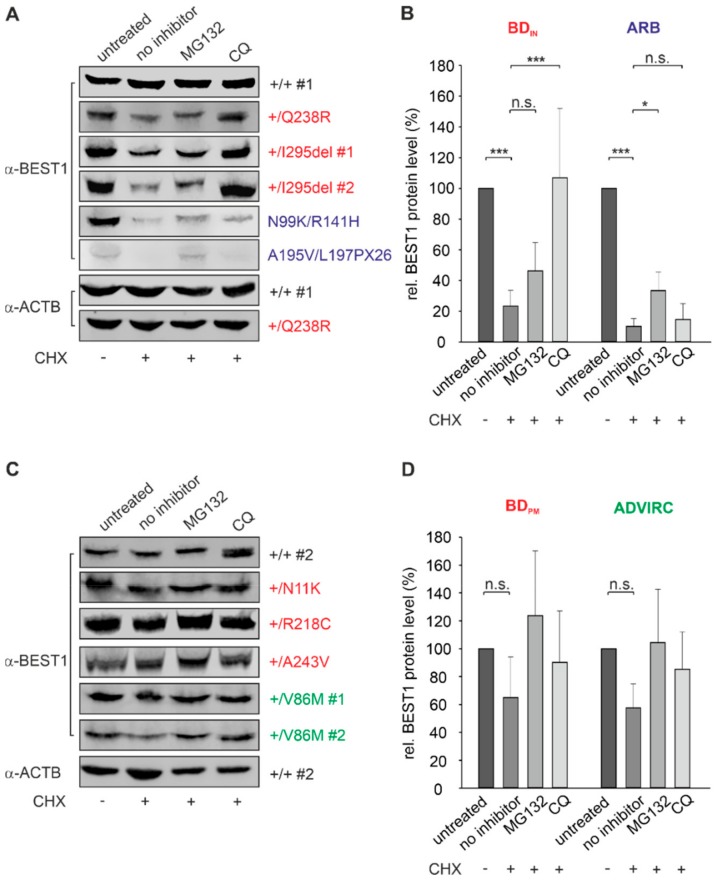
Figure 4.
Degradation pathways for BEST1 clearance in BD, ARB, and ADVIRC hiPSC-RPEs. Representative Western blot images after α-BEST1 immunoblot staining of whole cell lysates from untreated and treated hiPSC-RPEs of (A) control +/+ #1 and patients associated with BDIN and ARB, respectively. (B) Summary of BEST1 protein expression obtained from experiments shown in (A). Representative Western blot images after α-BEST1 immunoblot staining of whole cell lysates from untreated and treated hiPSC-RPEs of (C) control +/+ #2 and patients associated with BDPM and ADVIRC, respectively. (D) Summary of BEST1 protein expression obtained from experiments shown in (C) relative to untreated samples and normalized against β-actin from the same blot. Samples in (A) and (C) were assayed after 12 h of CHX treatment (20 µg/mL) in the absence or presence of proteasomal inhibitor MG132 (40 µM) or lysosomal inhibitor chloroquine (CQ) (100 µM). In (B) and (D) graphs for BDIN, BDPM, ARB, and ADVIRC samples are averaged and mean values are given as mean ± SD from two technical replicates per individual sample (n = 13). A summary of hiPSC clones used in the experiments is given in Supplementary Table S4. Statistical analysis was performed applying Kruskal-Wallis test, following post-hoc Dunn’s multiple comparisons test including Benjamini-Hochberg procedure: * = p < 0.05; *** = p < 0.001; n.s. = not significant.

