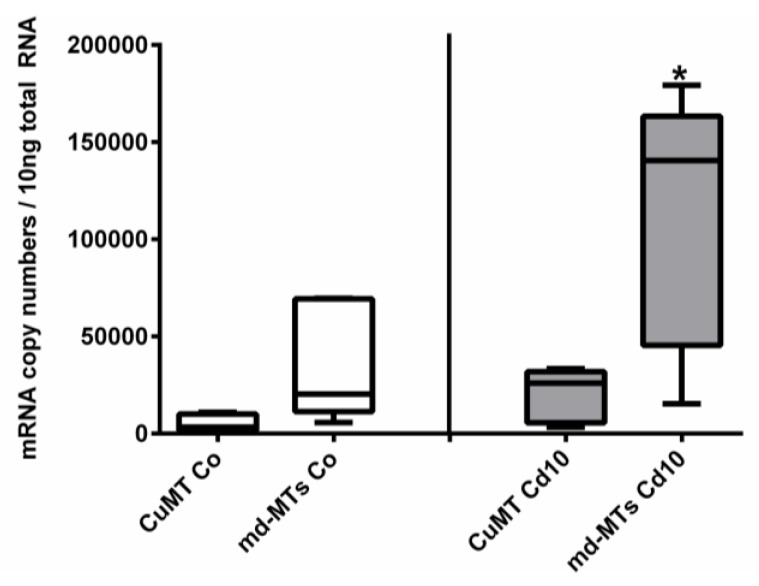
Figure 7.
Comparison of mRNA expression levels of CuMT versus joined md-MT genes (9md-MT + 10md-MT) in A. biplicata. Whisker box plots from the lowest to the highest values, showing transcription levels for controls (white whisker box plots, left-hand side) and snails exposed to 355 µg/g d.w. (Cd10) (grey whisker box plots, right-hand side; n = 5 each). The box of each treatment group extends from the 25th to the 75th percentile, with the square line showing the median. Asterisks (*) indicate significance (p < 0.05) upon comparison between CuMT transcription versus md-MT transcription in exposed snails (Cd10).

