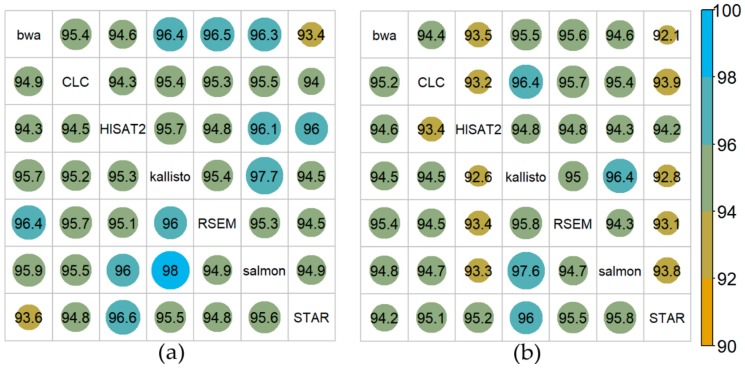
Figure 5.
Overlap of significantly differentially expressed genes among the different mappers for cold acclimated vs control plants. Overlap in % for Col-0 (a) and N14 (b). DGE was determined at FDR p < 0.1 and an absolute log2FC > 1 using the R-package DESeq2. Overlap of differentially expressed genes among each pair of mappers is represented in an asymmetric matrix.

