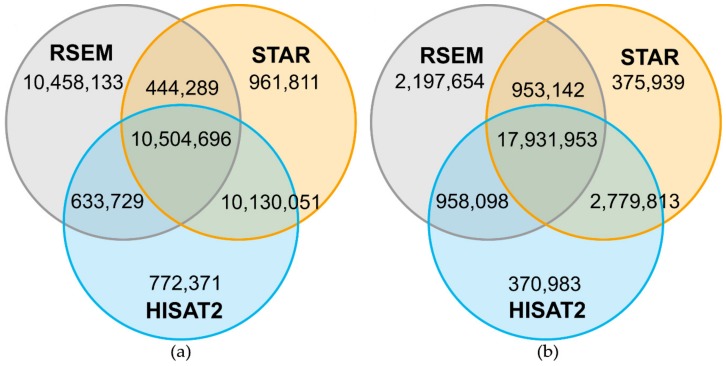
Figure 7.
Number of reads mapping on the same genomic position comparing HISAT2, RSEM and STAR for N14. Venn diagrams are based on 22,040,847 reads mapped by all three mappers and represent the overlap of mapped reads on the same genomic position for sample B (see Table A3 for sample information). A high number of the uniquely mapped reads in RSEM was based on soft-clipping by one bp performed by HISAT2 and STAR (a). The reads in HISAT2 and STAR were corrected by adding the soft-clipped bp back and the overlap with RSEM increased strongly (b).

