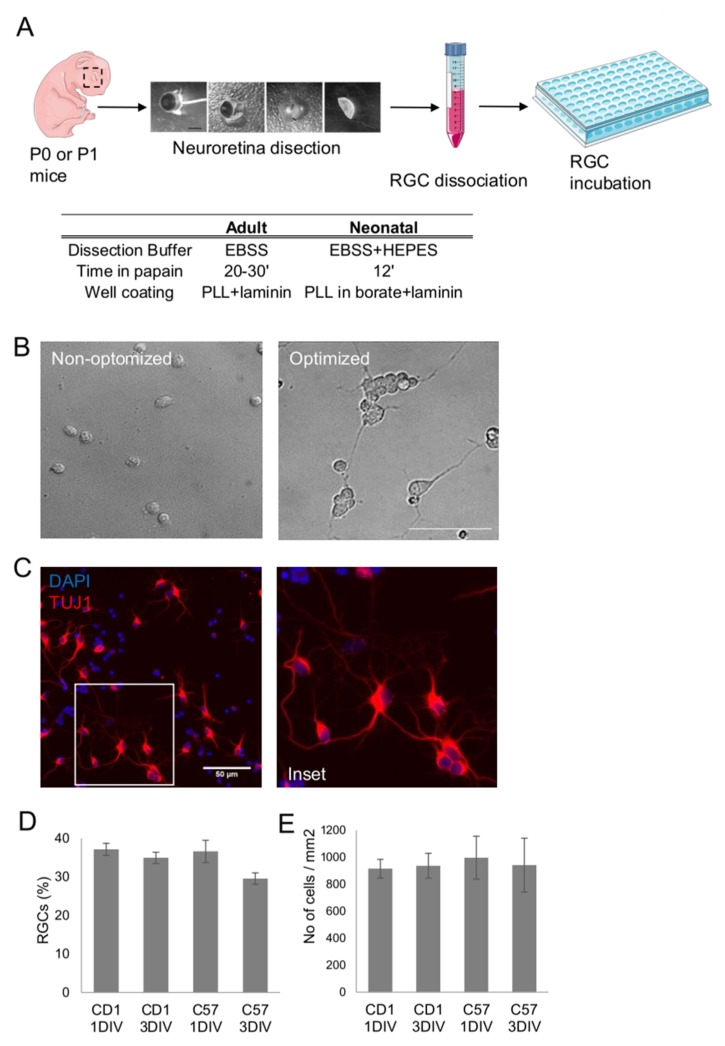
Figure 1.
RGC culture optimization. (A) Experimental design and optimization steps for the improved isolation and culture. (B) Representative bright field images of the RGCs before and after the optimization protocol, scale bar 25 µm. (C) Representative β-III tubulin staining in red of RGCs 3 DIV, nuclei stained with DAPI is shown in blue, scale bar 50 µm. (D,E) % of RGCs and number of cells/mm2 in the primary cultures isolated from CD1 and C57 mouse strains.

