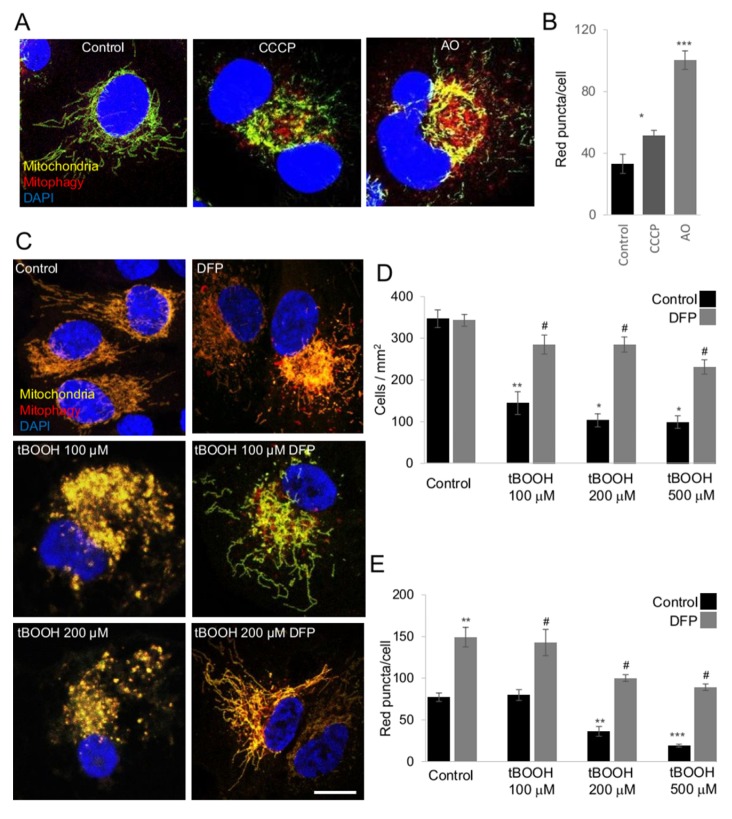
Figure 3.
Mitophagy monitoring with mito-QC reporter cells. ARPE19 mito-QC cells were incubated with different mitophagy inducers, 10 µM CCCP, antimycin 10 µM plus oligomycin 1 µM for 24 h. Representative confocal images of ARPE19 mito-QC cells after 24 h of incubation with the indicated treatments, as well as corresponding control cells are displayed in (A) scale bar 10 µm. (B) Quantification of red-only puncta in cells treated as in A. (C) Representative confocal images of control cells, cells incubated with 0.25 mM DFP, cells treated with the indicated doses of tBOOH with or without the presence 0.25 mM DFP for 24 h, scale bar 10 µm. (D) Quantification of the number of viable mito-QC ARPE-19 cells treated as in C. (E) Quantification of the number of puncta (red-only dots per cell) in cells treated as in C. * p < 0.05 vs. control, ** p < 0.01 vs. control; *** p < 0.001 # p < 0.05 vs. treatment.

