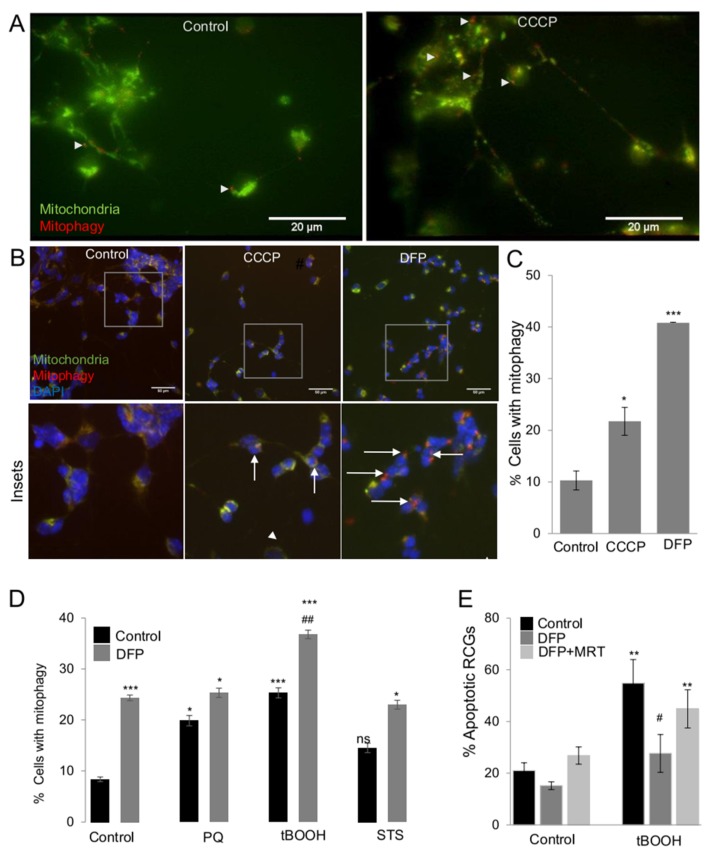
Figure 4.
Mitophagy induction and rescue from oxidative stress in mito-QC primary RGCs. (A) Primary RGCs isolated from P0 mito-QC mice were incubated with CCCP at 10 µM for 3 h. Representative images in live RGCs, note the red-only puncta that are labeled with white arrows. Scale bar 20 µm. B. Primary RGCs isolated from P0 mito-QC mice were incubated for 24 h with 25 µM CCCP and 2.5 mM DFP. Representative epifluorescence images are shown in (B), where the red puncta indicative of mitophagy are depicted with white arrowheads. The quantification of the % of mitophagy positive cells is depicted in (C). (D) Primary RGCs isolated from P0 mice were treated for 24 h with 2 mM PQ, 200 µM tBOOH and 3.5 µM STS, in the presence or absence of 0.25 mM DFP for 24 h. After the incubation cells were fixed and stained with b-III-tubulin (TUJ1) and DAPI. The % of apoptotic RGCs was determined by counting TUJ1 positive cells with condensed apoptotic nuclei. The number of RGCs was counted in at least 8 fields of three different experiments. * p < 0.05 vs. control; *** p < 0.001 vs. control, # p < 0.05 vs. treatment, ## p < 0.01 vs. treatment. (E) Primary RGCs isolated from P0 mito-QC mice were incubated with 200 µM tBOOH in the presence or absence of 0.25 mM DFP and 1 µM MRT for 24 h. After the incubation cells were fixed and stained with b-III-tubulin (TUJ1) and DAPI. The % of apoptotic RGCs was determined by counting TUJ1 positive cells with condensed apoptotic nuclei. The number of RGCs was counted in triplicates in 4 fields per condition (>200 RGCs per condition) * p < 0.05 vs. control; ** p < 0.01 vs. control # p < 0.05 vs. treatment.

