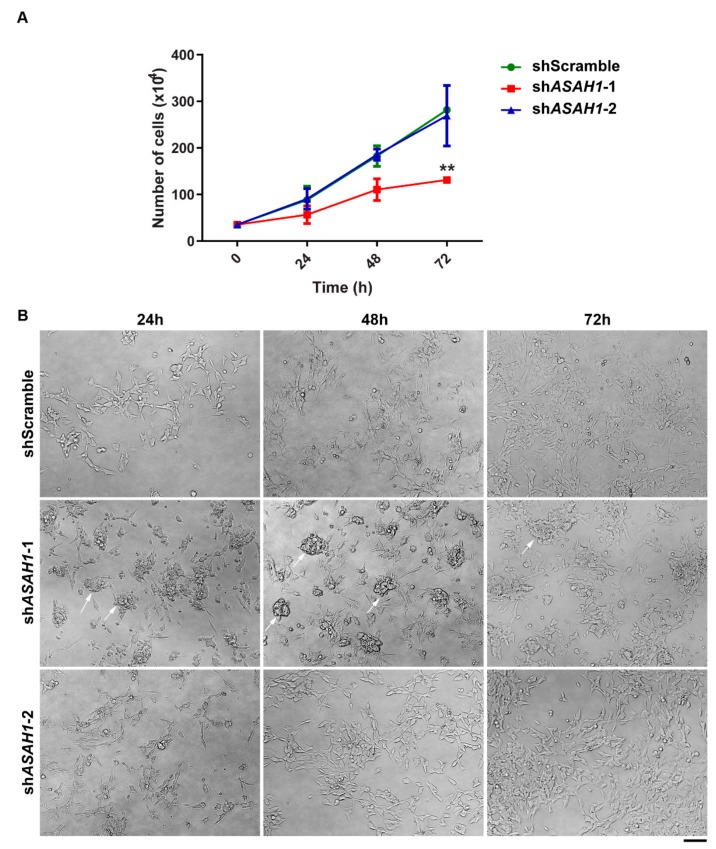
Figure 2.
shASAH1-1 SH-SY5Y cell line displays lower proliferation rate and morphological alterations. (A) Growth curves of three different SH-SY5Y cell lines, shScramble (green line), shASAH1-1 (red line) and shASAH1-2 (blue line), were constructed by scoring trypan blue-negative cells at 0, 24, 48, and 72 h after cell seeding. Data are expressed as the mean ± SD of two independent experiments. ** p < 0.005 compared to shScramble cells (two-way ANOVA analysis) (B) Representative pictures of cell growth and morphology using phase contrast microscopy. The scale bar represents 40 μm for all panels.

