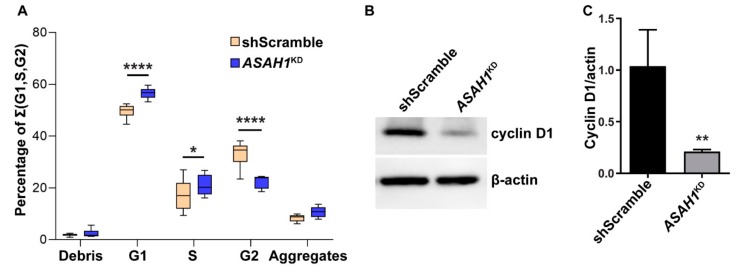
Figure 3.
Acid ceramidase (AC) depletion induces G1/S cell cycle arrest of ASAH1KD cells. (A) Cell cycle progression was assessed using propidium iodide and flow cytometry analysis. The graph gives percentages of G1, S, and G2 as a total of 100% with relative percentages of debris and aggregates, in ASAH1KD and shScramble cells. * p = 0.02, **** p < 0.0001 compared to shScramble (n = 6, two-way ANOVA of percentages). (B) Representative Western blot results showing decreased expression levels of cyclin D1 in ASAH1KD cells. β-actin was used as loading control. (C) Graph of densitometric measurements of cyclin D1 expression normalized with β-actin internal control, as illustrated in panel B. Data are expressed as mean ± SD (n = 3, ** p < 0.006, Student t-test).

