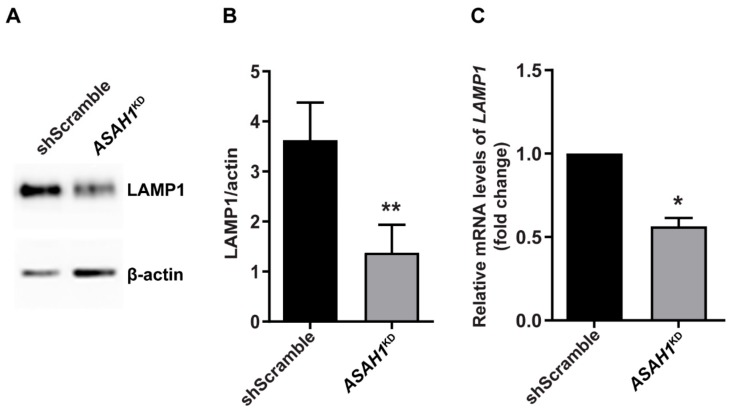
Figure 6.
Decrease of protein and mRNA levels of LAMP1 in ASAH1KD cells. (A) Representative immunoblot using antibodies against LAMP1 and β-actin. (B) Levels of LAMP1 normalized for β-actin expression. Data are expressed as mean ± SD (n = 4, ** p < 0.003, Student t-test). (C) Relative mRNA expression levels of LAMP1 in ASAH1KD cells to shScramble cells after normalization with GAPDH. Data are represented as the mean ± SEM of two independent triplicate experiments (* p = 0.02, Student t-test).

