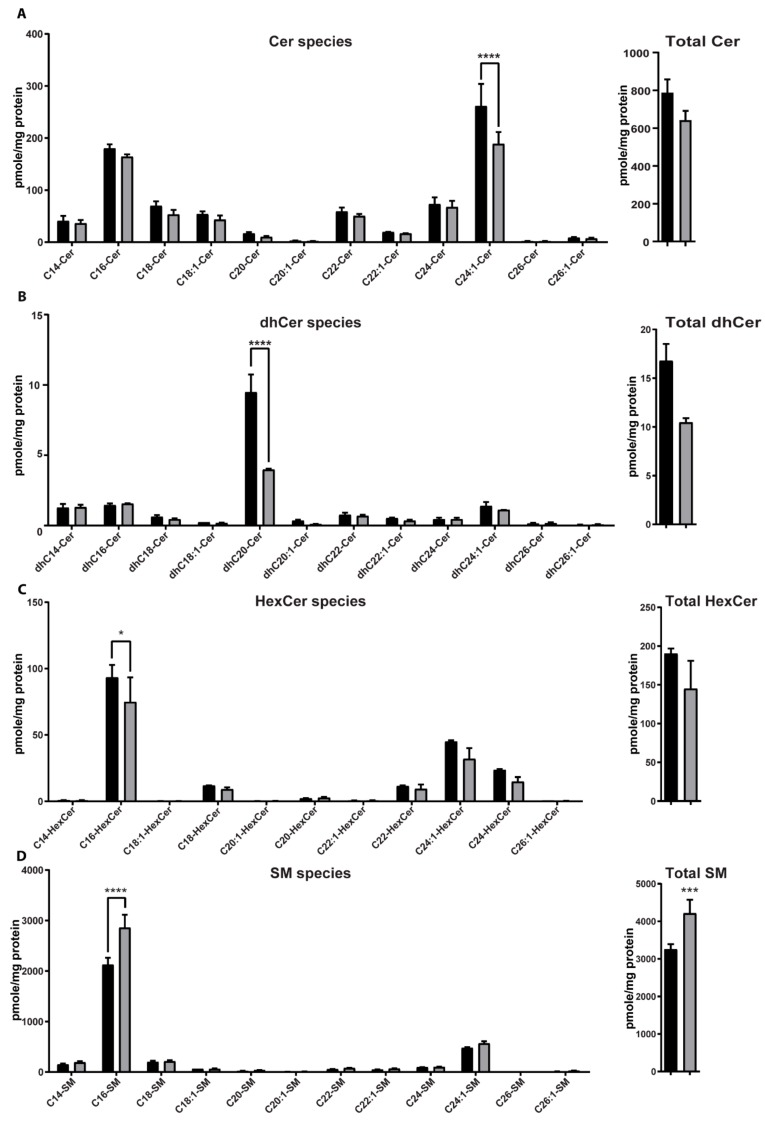
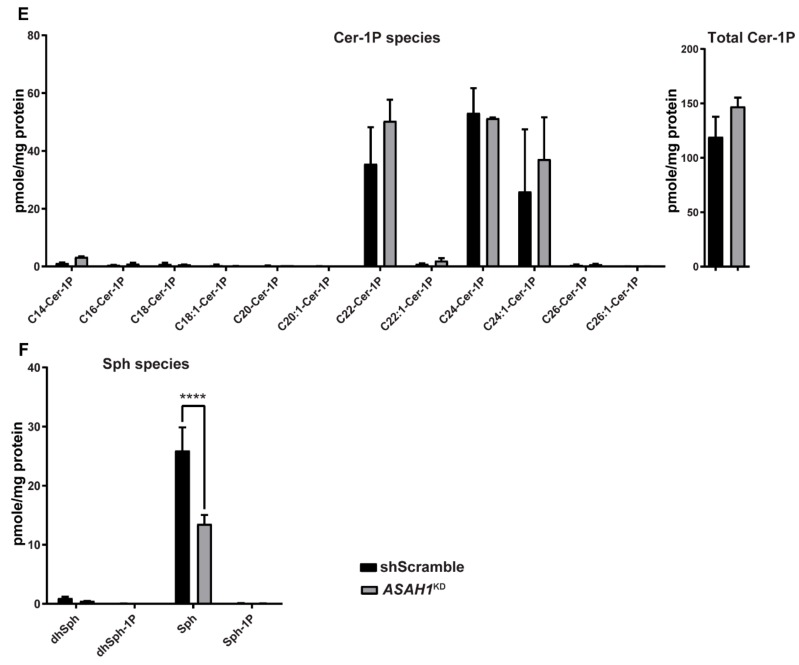
Figure 9.
AC depletion causes changes in sphingolipid content. HPLC-MS/MS quantification analysis of the intracellular levels of different subspecies of medium- and longer-chain sphingolipids in shScramble (black color) and ASAH1KD (grey color) cells: (A) ceramide (Cer), (B) dihydroceramide (dhCer), (C) hexosylceramide (HexCer), (D) sphingomyelin (SM), (E) ceramide-1-phosphate (Cer-1P) and (F) dihydrosphingosine (dhSph), dihydrosphingosine-1-phospate (dhSph-1P), sphingosine (Sph) and sphingosine-1-phospate (Sph-1P). The different subspecies are represented with the chain length and number of double bonds. To the right of panel A through E, the total amount of the particular sphingolipid is presented. Results are expressed as mean ± SD in pmoles/mg protein (n = 2, * p = 0.01, *** p < 0.001 and **** p < 0.0001, two-way ANOVA).


