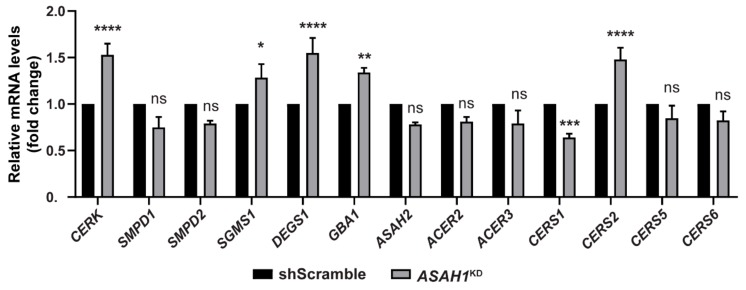
Figure 10.
Altered mRNA levels of genes expressing enzymes of ceramide metabolism in ASAH1KD cells. The graph represents the mRNA levels of CERK (Cer kinase), SMPD1 and SMPD2 (acid and neutral sphingomyelinase), SGMS1 (SM synthase 1), DEGS1 (delta 4-desaturase, sphingolipid 1), GBA (glucosylceramidase beta), ASAH2 (neutral ceramidase), ACER2 and ACER3 (alkaline ceramidases 2 and 3) and ceramide synthases (CERS1, CERS2, CERS5, and CERS6) sphingolipid genes in ASAH1KD cells relative to shScramble cells after normalization with the endogenous GAPDH gene. Values represent the mean ± SEM of three independent triplicate experiments. Asterisks indicate statistically significant (* p < 0.05, ** p < 0.01, *** p < 0.001, and **** p < 0.0001 significant, two-way ANOVA analysis).

