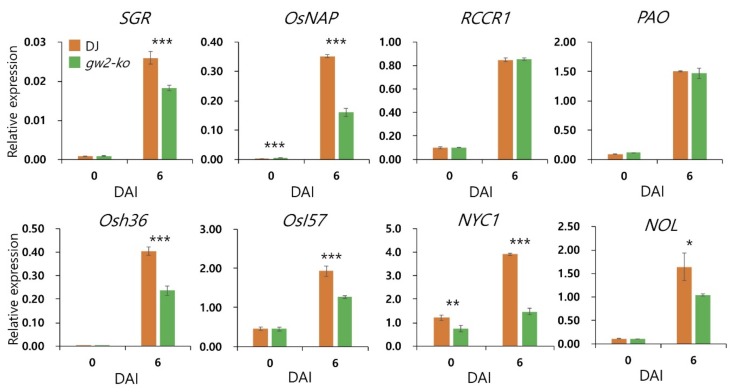
Figure 7.
Expression of senescence-associated genes and chlorophyll degradation genes compared in Dongjin and gw2-ko. qRT-PCR was conducted to determine the transcript level of genes. OsUBQ5 was used for normalization. Error bars indicate the standard deviation of three replications. *, **, and *** indicate significant difference at p < 0.05, p < 0.01, and p < 0.001 based on Student’s t-test, respectively. DAI: days after incubation.

