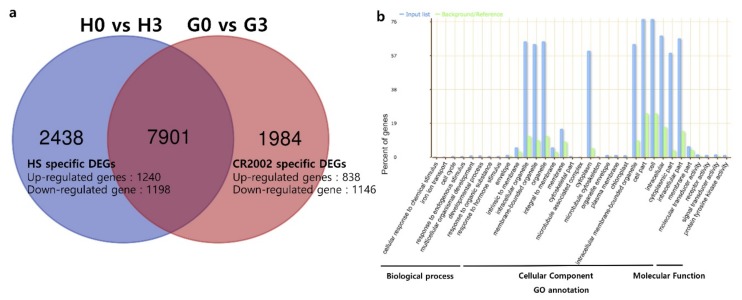
Figure 8.
Summary of the numbers of differentially expressed genes (DEGs) upon incubation of leaves of two lines (Hwaseong and CR2002) in complete darkness. (a) A Venn diagram, showing the number of genes shared and distinct to each genotype. (b) Significantly enriched gene ontology (GO) terms for CR2002-specific DEGs. Blue and green bars indicate the input list of CR2002 and background/reference, respectively. H0, H3, G0, and G3 indicate Hwaseong day 0, Hwaseong day 3, CR2002 day 0, and CR2002 day 3 in dark condition, respectively.

