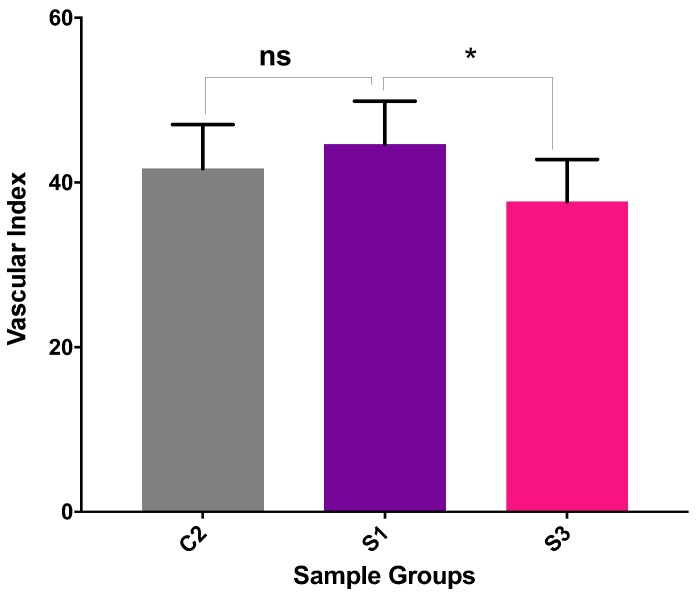
Figure 12.
Quantification of angiogenesis on the images taken in the sacrificing day of embryos (day-14) in the following samples: C2: CS.0.1HA; S1: CS.0.1HA.0.005Hep (0.12 mg/mL Hep); S3: CS.0.1HA.0.025Hep (0.60 mg/mL Hep) (ns and * represent the p values which are equal to 0.3482 and 0.0408, respectively).

