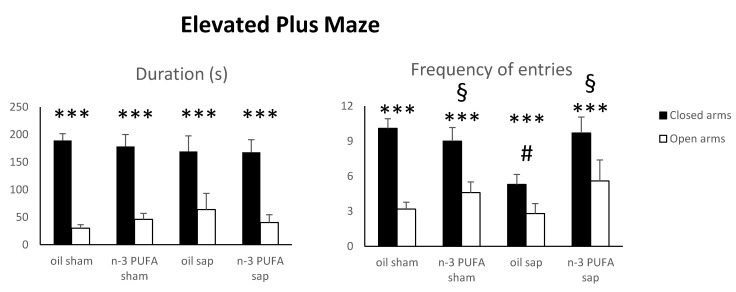
Figure 2.
Elevated Plus Maze data. Duration and frequency of exploration of the closed and open arms in the four experimental groups. Data are reported as mean and SEM (oil sham, n = 12; n-3 PUFA sham, n = 10; oil sap, n = 10; n-3 PUFA sap, n = 10). Arm effect: *** p < 0.000001; Diet effect: § p < 0.05; Diet x lesion effect: # p < 0.05.

