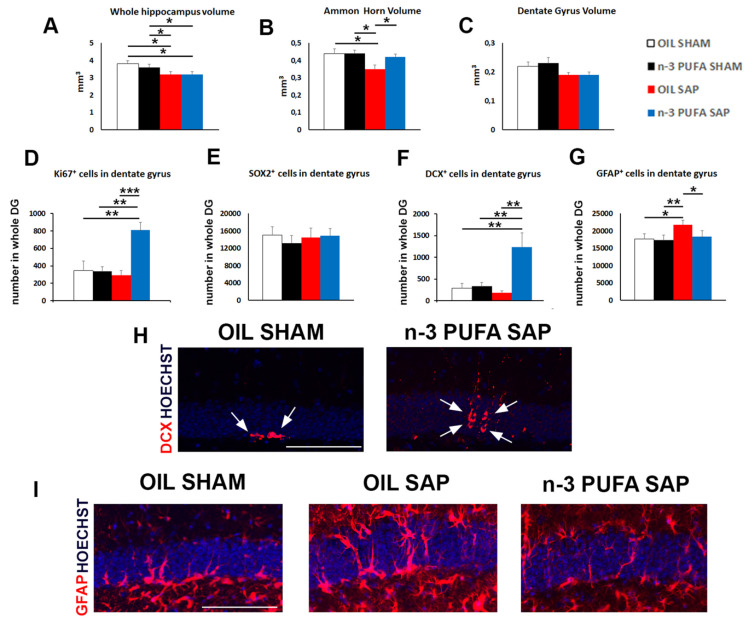
Figure 5.
Morphological results. (A–C). Diagrams showing the variations of volume in the whole hippocampus, Ammon’s Horn (CA1 + CA3) and Dentate Gyrus (DG) in the four experimental groups (n = 5 mice/group). (D). Graph showing the large increase of Ki67-positive neuroblasts in the n-3 PUFA sap group in respect to the other groups. (E). Graph representing the unchanged values detected in the SOX2+ sub-populations. (F). Diagram showing the enhancement of DCX-positive neuroblasts in the n-3 PUFA sap group in respect to the other groups. (G). Histogram indicating the GFAP+ cell number in the DG. (H). Representative images showing the increase in the DCX+ cells (red, arrows) in the DG of the n-3 PUFA sap mice, when compared with oil sham group. (I). Representative fluorescence images of GFAP+ cells (red), showing the increased astrogliosis in the oil sap group, counteracted by the pre-treatment with n-3 PUFA. Scale bar 100 µm. * p < 0.05, ** p < 0.01, *** p < 0.001; Student’s t test.

