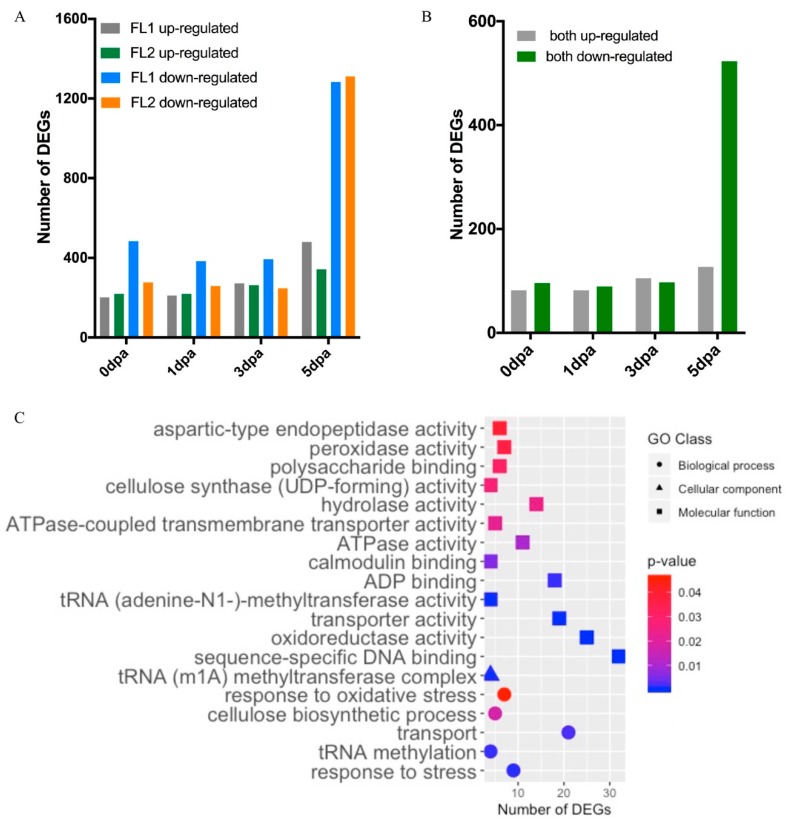
Figure 8.
Transcriptome analysis results of the fuzzless accessions (FL). (A) Number of DEGs identified in pairwise comparison between FL1 and Normal and FL2 and Normal. (B) Number of DEGs that were up- or down-regulated in both FL1 and FL2. (C) Enriched GO terms based on DEGs up- and down-regulated in both FL1 and FL2.

