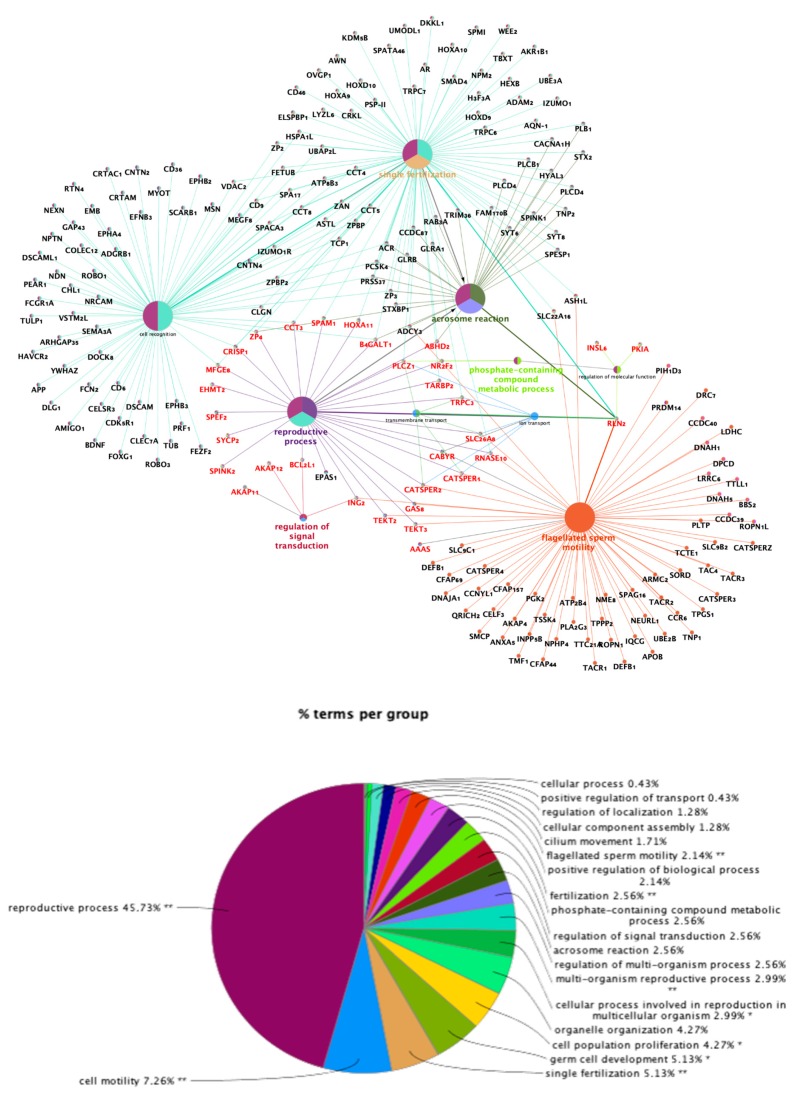
Figure 3.
Schematic representation of functionally grouped terms. This network was created using the Cytoscape v3.0.0 application and the ClueGO+CluePedia (version 2.2.5) plug-in. Terms and their associated genes share the color. Genes marked in red are overrepresented in our study. The size of the nodes indicates the degree of significance, where the biggest nodes correspond to highest significance. The parameters included: biological process database (BP; date: 28.03.2019); GO tree levels, 2–6 (first level = 0); minimum number of genes, 3; minimum percentage of genes, 4; GO term fusion; GO term connection restriction (kappa score), 0.4; GO term grouping, initial group size of 2 and 50% for group merge; number of genes included in term <100. The resulting network was modified; that is, some redundant and noninformative terms were deleted and the network manually rearranged.

