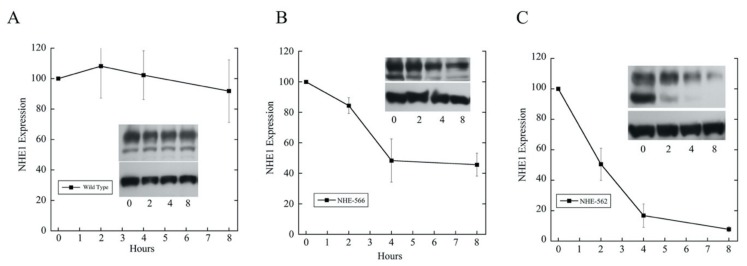
Figure 6.
Protein levels of wild type and mutant NHE1 proteins were measured at time 0, (starting time) and up to 8 h after cycloheximide (50 μM) treatment. Equal amounts of total proteins were loaded in each lane, and NHE1 levels were then determined by Western blotting against the HA tag on NHE1. Quantification was estimated by using the Image J 1.35 software. Insets are example Western blots that show NHE1 levels in the upper panel in comparison to tubulin levels (lower panels). Time points are at 0, 2, 4 and 8 h. Results are mean ± S.E. of at least 3 experiments.

