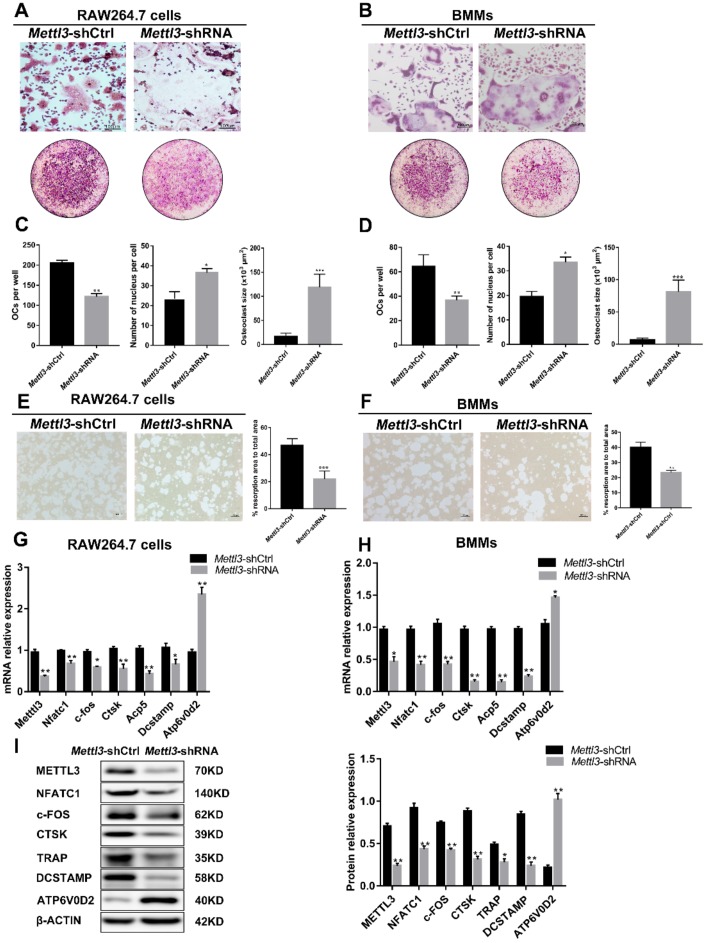
Figure 3.
Effect of Mettl3 knockdown on osteoclast formation and function. RAW264.7 cells (A,C,E,G,I) and BMMs (B,D,F,H) in the Mettl3-shCtrl or Mettl3-shRNA groups were induced to differentiate into osteoclasts. (A,B) The images of TRAP staining showed mature osteoclasts differentiated from RAW264.7 cells (A) and BMMs (B). The upper images are at high microscope power (original magnification 100×). The under images are at low microscope power (original magnification 5×). (C,D) Number of TRAP-positive multinuclear cells per well and number of nuclei in the cultured TRAP-positive osteoclasts. The average size of each osteoclast (×103 μm2) was determined by image analysis using the ImageJ software. (E,F) Resorption activity of osteoclasts in the Mettl3-shCtrl and Mettl3-shRNA groups was assessed by pit formation assay. The “black” scale bars represent 100 µm. The osteoclast resorption area as a percentage of total area was calculated using Image-Pro. (G,H) The mRNA levels of Nfatc1, c-fos, Ctsk, Acp5, Dcstamp and Atp6v0d2 were measured by qRT-PCR. (I) The protein levels of NFATC1, c-FOS, CTSK, TRAP, DCSTAMP and ATP6V0D2 were assessed by Western blotting. The band densities were analyzed using ImageJ. β-Actin was used as a normalization control. All of the data are presented as the mean ± SD (n = 3). Significant differences relative to the Mettl3-shCtrl group. * P < 0.05; ** P < 0.01; *** P < 0.001.

