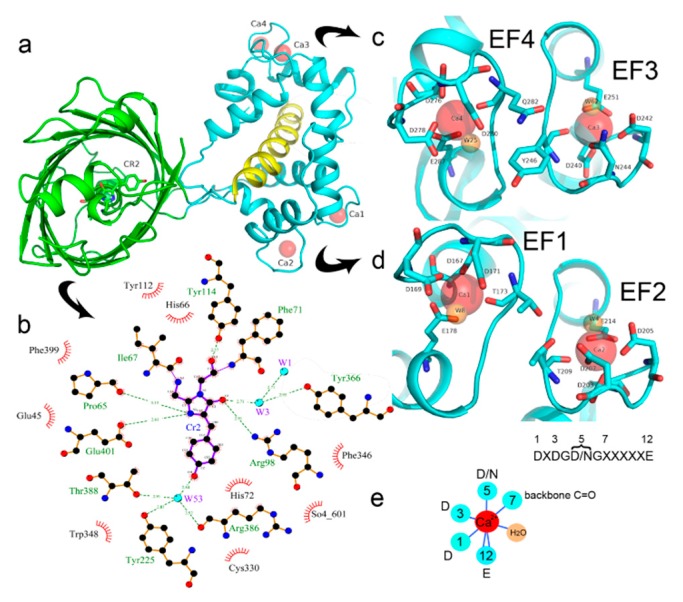
Figure 2.
Overview of the crystal structure for the NCaMP7 indicator (PDB ID—6XW2). (a) Cartoon representation of NCaMP7 crystal structure (90 degrees rotated as compared to Figure 1a). The immediate surroundings of the chromophore (b) and calcium ions (c,d). (e) The coordination sphere of the calcium ion (in red) and positions for the calcium-coordinating residues in the sequence of EF1-4-hands loops (X means different residues observed in the same position among the four EF1-4-hands of NCaMP7). Hydrogen bonds and water molecule are shown as blue lines and orange circle, respectively.

