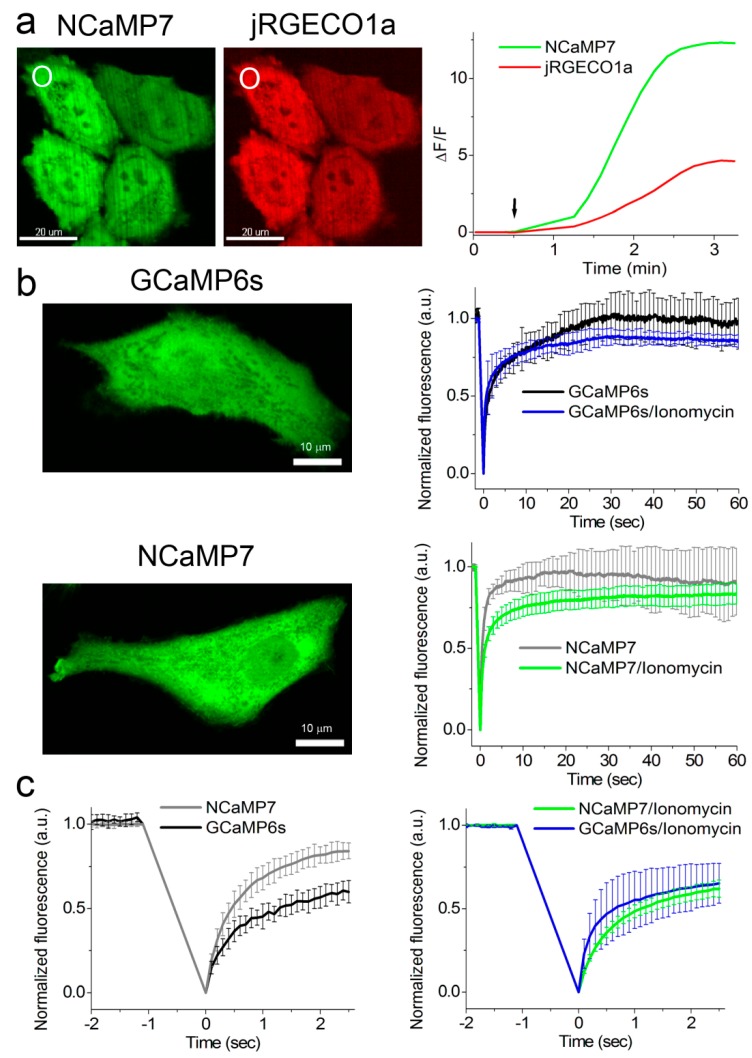
Figure 3.
Response of the NCaMP7 indicator to Ca2+ variations in HeLa cells. (a) Confocal images of HeLa cells co-expressing green NCaMP7 (left) and red jRGECO1a (right) calcium indicators. The graph illustrates changes in green or red fluorescence of the NCaMP7 and reference co-expressed jR-GECO1a genetically encoded calcium indicators (GECIs) in response to the addition of 2.5 µM of ionomycin. The changes on the graph correspond to the area indicated with white circles. One example of five is shown. (b) Example of confocal images of HeLa cells expressing GCaMP6s and NCaMP7 calcium indicators used for the fluorescence recovery after photobleaching (FRAP) experiments. The graphs illustrate FRAP induced changes in green fluorescence of NCaMP7 and control GCaMP6s GECIs at physiological Ca2+ concentrations and in response to the 5 µM ionomycin addition for a 60 s time scale. (c) FRAP changes for 2.5 s time scale. (b,c) Error bars are standard deviations across five cells.

