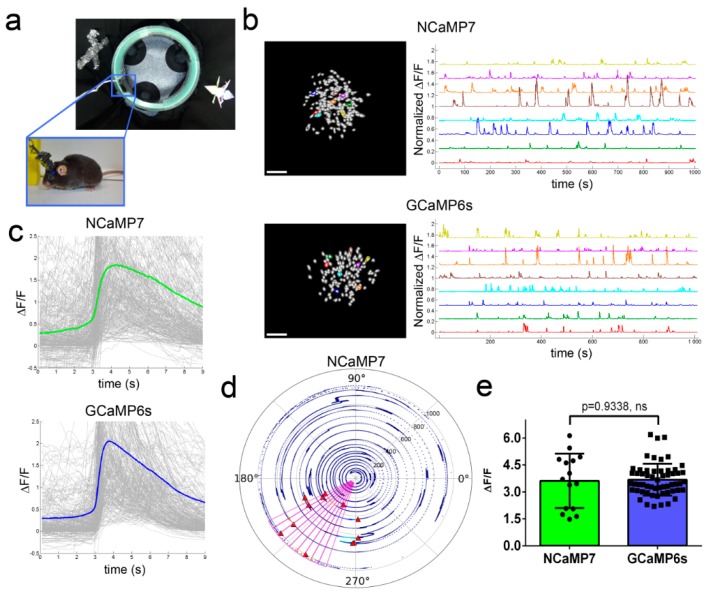
Figure 5.
In vivo neuronal Ca2+ activity in the hippocampus of freely behaving mice visualized using NCaMP7 and GCaMP6s calcium indicators and a one-photon nVista HD miniscope. (a) Photo of O-shaped track with landmarks and mouse which explores it with an nVista HD miniscope mounted on its head. (b) Spatial filters and sample traces obtained from a 15-min imaging session of freely behaving mice expressing NCaMP7 and GCaMP6s GECIs. Scale bar, 100 µm. (c) Mean spikes for NCaMP7 and GCaMP6s calcium indicators; spikes above the 4 median absolute deviation (MAD) threshold, and not less than 50% of the maximal trace value, were aligned at the start of the peak (3 s). (d) Example of a circular plot for NCaMP7 mouse trajectory during the exploration of the circular track, synchronized with the spikes of a place cell (red triangles). (e) Averaged ΔF/F responses for space-evoked activity across place neuronal cells (n = 3, NCaMP7; n = 5, GCaMP6s) in the CA1 area of the hippocampus for the NCaMP7 and GCaMP6s indicators. The NCaMP7 and GCaMP6s indicators were delivered to the hippocampus with rAAVs carrying AAV-CAG-NES-NCaMP7/GCaMP6s. Ns, not significant.

