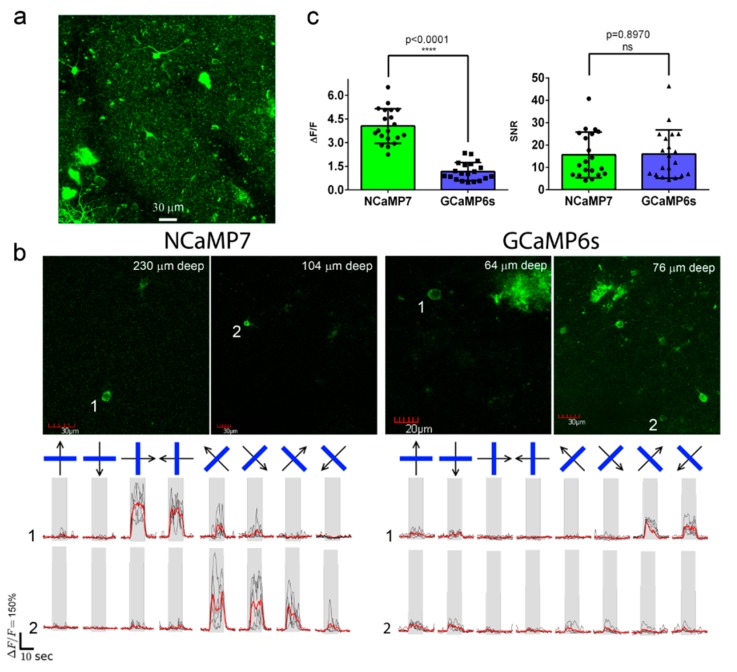
Figure 6.
In vivo drifting grating-evoked neuronal activity in the mouse cortex visualized using NCaMP7, GCaMP6s calcium indicators, and two-photon microscopy. (a) The three-dimensional (3D) reconstruction of NCaMP7-positive cells in the V1 visual cortex area excited with 960 nm light. Block size, 360 × 360 × 470 µm. (b) Two-photon images of the V1 layer 2/3 neurons acquired during the presentation of drifting grating to the mice expressing NCaMP7 and GCaMP6s indicators. Raw (in black) and averaged (in red, averaged across five repetitions) ΔF/F responses during the presentation of drifting gratings (eight directions, five repetitions) are shown for the marked neurons. The directions of the drifting gratings (blue lines) are shown with arrows (in black). Grey vertical boxes correspond to the time of the grating presentation. (c) Averaged ΔF/F responses and SNR for grating-evoked activity across neurons (n = 2, NCaMP7; n = 2, GCaMP6s) in the V1 area for the NCaMP7 and GCaMP6s indicators.

