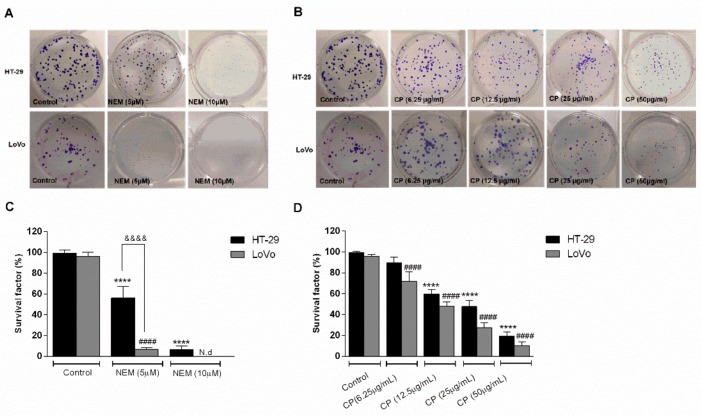
Figure 2.
Effect of NEM (A,C) and CP (B,D) on the clonogenic capacity of colorectal cancer (CRC) cells. Magnification: 10×. Data are expressed as survival factor and represent the mean ± S.D. of three independent experiments. **** p < 0.0001 vs. untreated cells. LoVo cells: #### p < 0.0001 vs. untreated cells. &&&& p < 0.0001 vs the other cell line treated with the same conditions. N.d: not detected.

