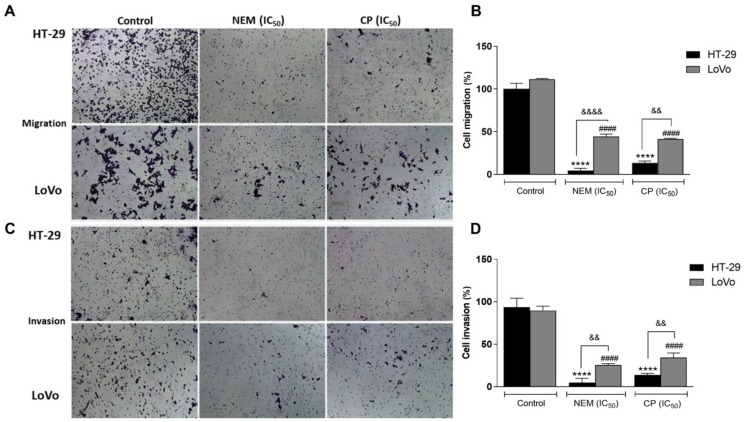
Figure 8.
Effect of NEM and CP (IC50/72 h) on cell migration (A,B); magnification 10×) and invasion (C,D). Data are expressed as mean ± SD of three different experiments. HT-29 cells: **** p < 0.0001 vs. control. LoVo cells: #### p < 0.0001 vs. control. && p < 0.01, &&&& p < 0.0001 vs. the other cell line treated with the same conditions.

