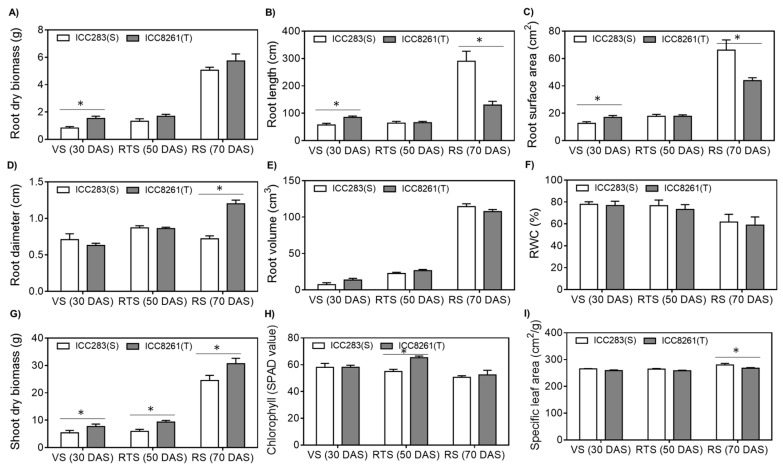
Figure 1.
Growth and physiological responses of tolerant (T, ICC8261) and sensitive (S, ICC283) chickpea genotypes to drought stress during vegetative (VS), reproductive transition (RTS) and reproductive (RS) stages. (A) root dry weight (B) root length (C) root surface area (D) average diameter (E) root volume (F) relative water content (G) shoot dry weight (H) chlorophyll content (I) specific leaf area (SLA). Error bars represent standard errors (SE). Physiological data were obtained from three independent biological replicates. Statistically significant differences between sensitive and tolerant genotypes obtained by one-way ANOVA at p < 0.05 are depicted by an asterisk (*).

