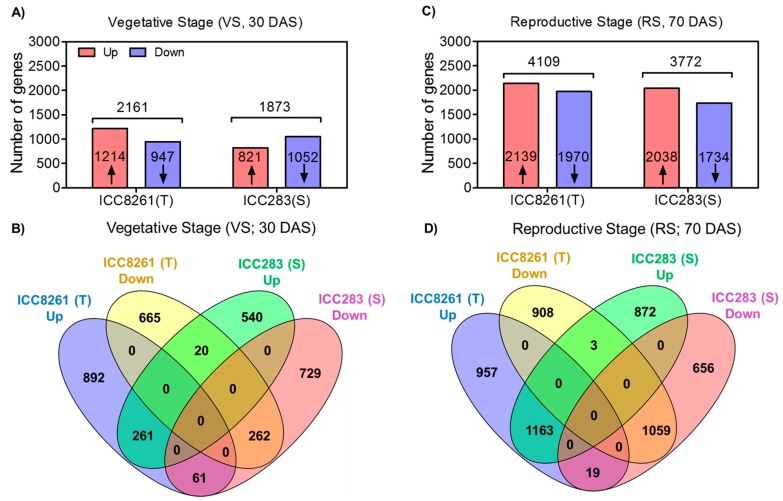
Figure 2.
Bar graphs and Venn diagram representing genotype- and developmental stage-specific differentially expressed genes (DEGs) in response to drought stress. (A) DEGs up- and down-regulated in the tolerant (T, ICC8261) and sensitive (S, ICC283) genotypes at the vegetative stage (VS); (B) Venn diagram showing commonly up- and down-regulated DEGs amongst the genotypes at the vegetative stage (VS); (C) DEGs up- and down-regulated in the tolerant (T, ICC8261) and sensitive (S, ICC283) genotypes at the reproductive stage (RS); (D) Venn diagram showing commonly up- and down-regulated DEGs amongst the genotypes at the reproductive stage (RS).

