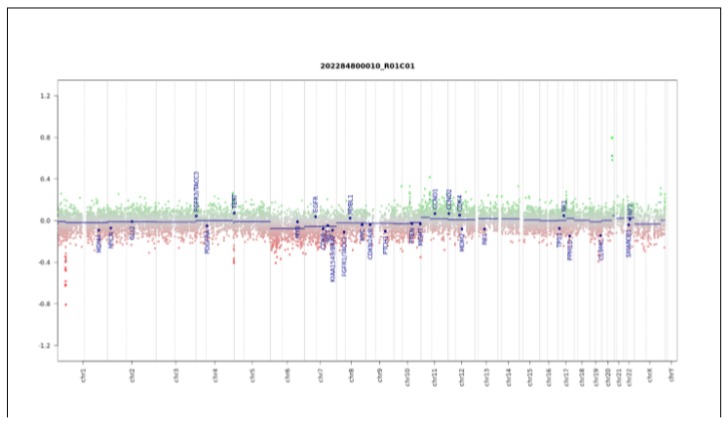
Figure 4.
Copy number variation (CNC) profile analysis. Depiction of structural rearrangements involving autosomes and X/Y chromosome. Gains/amplifications represent positive (green) and losses represent negative (red) deviations from the baseline. Twenty-nine tumor relevant genomic regions are highlighted.

