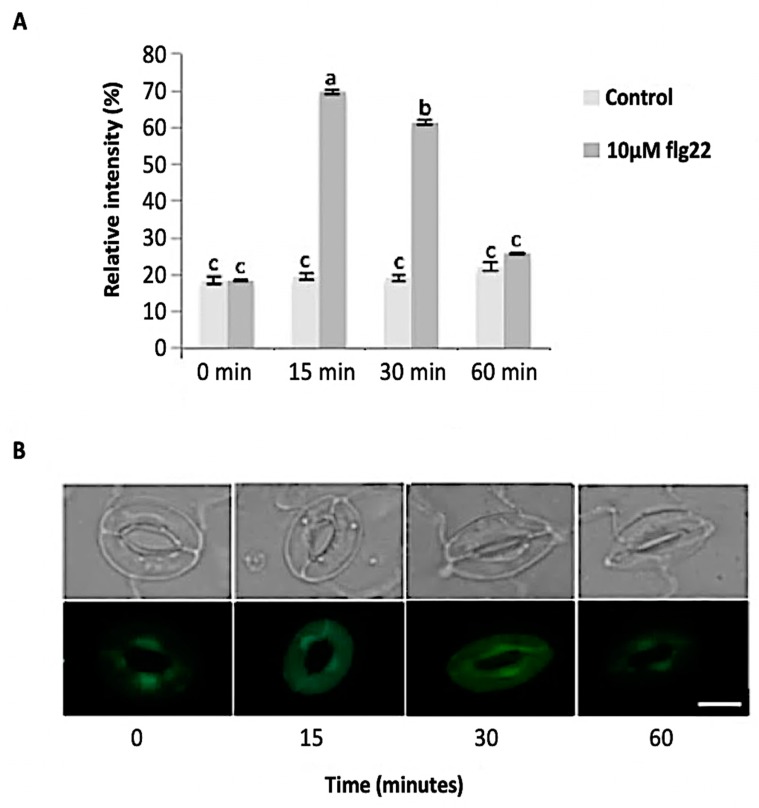
Figure 3.
Reactive oxygen species (ROS) sproduction in guard cells in response to 10 μM flg22. (A) ROS levels measured from a total of 180 stomata from three independent experiments and presented as means ± SE. Different letters indicate significantly different mean values at p < 0.05. (B) Representative images of stomatal guard cells at each time point are shown. Scale bar: 10 µm.

