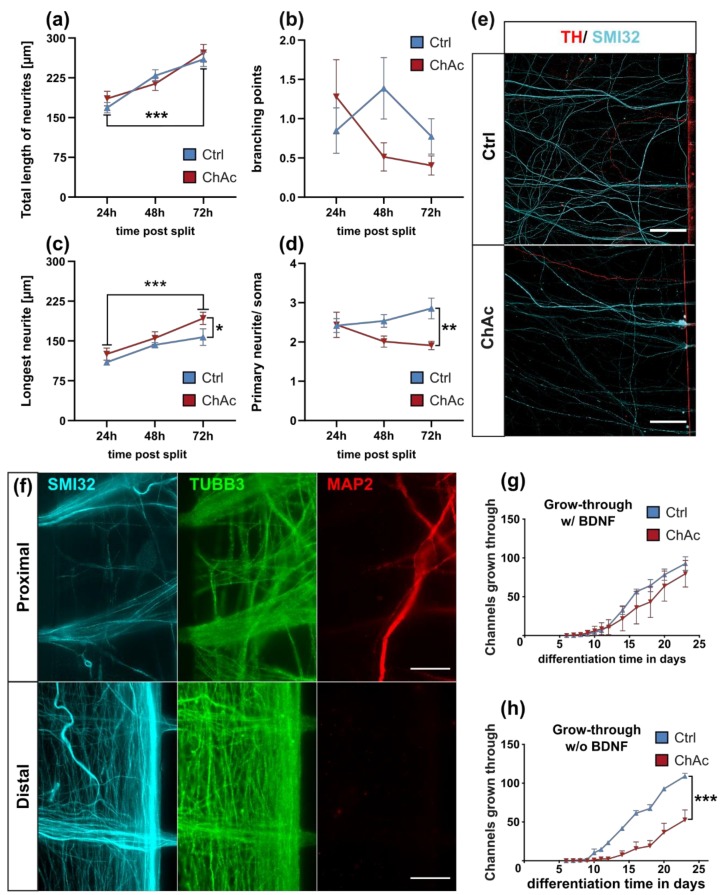
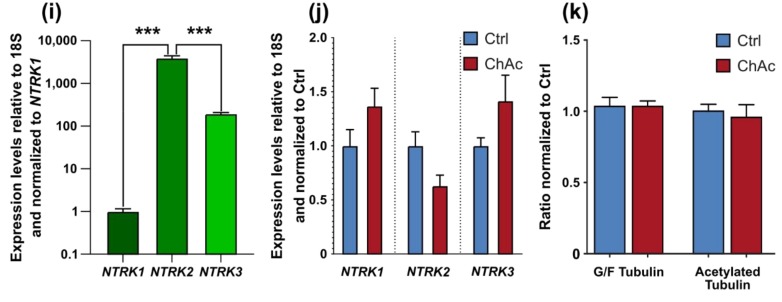
Figure 2.
Growth characteristics of differentiated midbrain/ hindbrain neurons. (a) The total length of all neurites, (b) the number of branching points, (c) the longest neurite and (d) the number of primary neurites per soma were investigated by IF imaging of individual neurons in low-density cell cultures over the course of 72 h (n ≥ 5). (e) Representative ICC images of neurons growing through the 900 µm long micro channel of a micro fluidic chamber (MFC). The applied brain-derived neurothrophic factor (BDNF) and glial cell line-derived neurotrophic factor (GDNF) gradient yield mostly TH- neurons, indicating that almost only motoneurons are capable of growing through the channels. (f) IF images of axons sprouting out of channel exits of MFCs. Only SMI32+ axons penetrate the MFC, while MAP2+ dendrites grow not through the micro channels. (g) Quantification of channel growth-through in the presence of BDNF was investigated by counting the axon-penetrated exit channels of MFCs (n = 3). (h) Quantification of channel growth-through in the absence of BDNF (n = 3). (i) Expression levels of NTRK1-3 was investigated by qPCR of three weeks old unguided neuronal cultures. Before normalization against NTRK1, expression values of each experiment were internally normalized to levels of 18S rRNA (n = 15). (j) Comparison of the expression levels of NTRK1-3 of ChAc patient iPSC derived midbrain/ hindbrain neuronal cultures and Ctrl ones. After expression values of each experiment were internally normalized to levels of 18S rRNA, further normalization against Ctrl-values was conducted (n ≥ 6). (k) Polymerization of tubulin and acetylation of α-tubulin were analyzed using western blots. G/F tubulin ratio was calculated by quantifying western blots of equal volumes of previously extracted globular and filaments containing fractions of three week old neuronal cultures. Acetylation of α-tubulin was measured by first detecting levels of acetylated tubulin and after antibody stripping reanalyzing the same western blot membrane with α-tubulin antibody (n ≥ 9). Scale bar = 20 µm, Data points and bars represent mean ± SEM. */**/*** represents p < 0.05/0.01/0.001.


