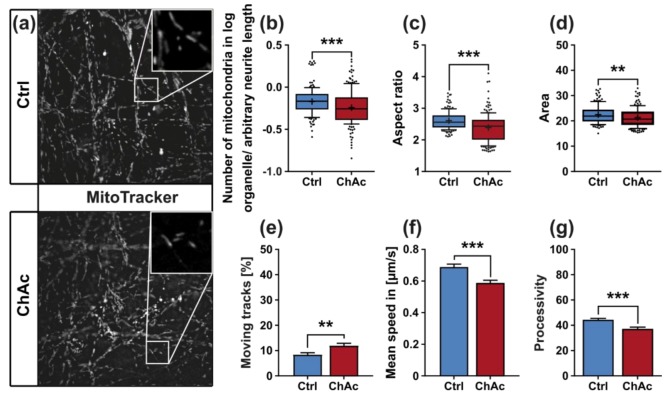
Figure 3.
Morphology and trafficking of mitochondria in midbrain/hindbrain neurons cultivated in unguided 96-wells. (a) Representative live cell images of mitochondria of ChAc-patient- and Ctrl-iPSC-derived mature midbrain/ hindbrain neurons grown in 96-wells using MitoTracker DeepRed. Analysis of the first image of each video stack with a Fiji macro allowed us to quantify. Magnification 1000x (b) the normalized number of mitochondria in neurons (c) the aspect ratio of the ellipses that were fitted over the observed mitochondria and (d) the pixel-size of mitochondria (n ≥ 154). (e) Movement of mitochondria was assessed using the TrackMate plugin developed in Fiji and subsequently filtering for objects with a displacement further than 1.2 µm. (f) Mean speed was calculated only from mitochondria, which were considered to be moving with a displacement above 1.2 µm. (g) Processivity of a moving mitochondrion was calculated by division of its displacement by its total track length. Boxes represent 25–75 percentiles, line represents median, whiskers represent 10–90%, + represents mean. Bars represent mean ± SEM. * indicate significant differences between genotype, **/*** represents p < 0.01/0.001.

