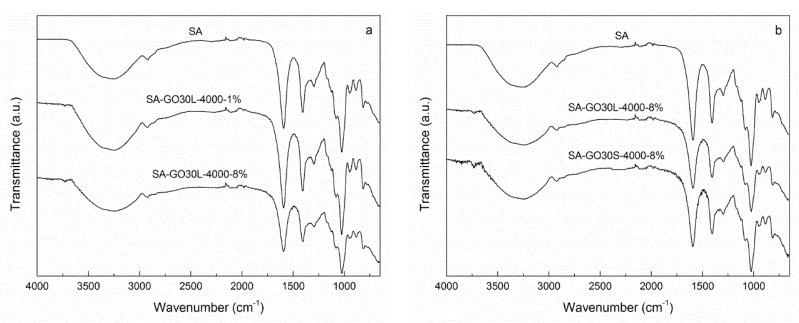
Figure 7.
FTIR spectra of (a) SA (sodium alginate) matrix, SA-GO30L-4000-1%, and SA-GO30L-4000-8% nanocomposites and (b) SA matrix, SA-GO30L-4000-8%, and SA-GO30S-4000-8% nanocomposites (y-axis of the curves was translated in order to avoid overlapping and to improve the visibility of the characteristic bands).

