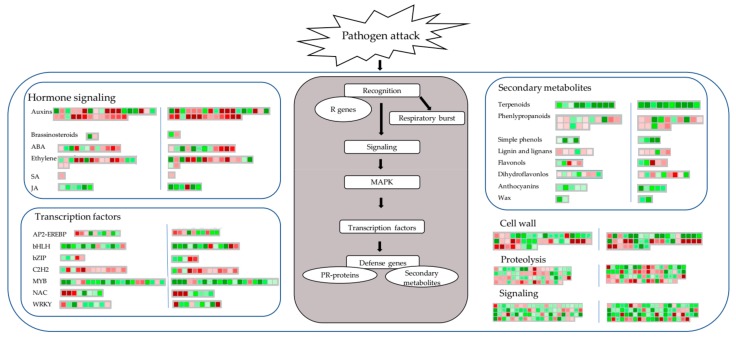
Figure 5.
Schematic diagram of biotic stress categories using the Mapman visualization platform. The gene expression ratios of HB1 (left of blue vertical line) and HB2 (right of blue vertical line) compared with CK were used in a Mapman analysis. The gradient of red squares and green squares indicates up- or down-regulated genes involved, respectively.

