Figure 3.
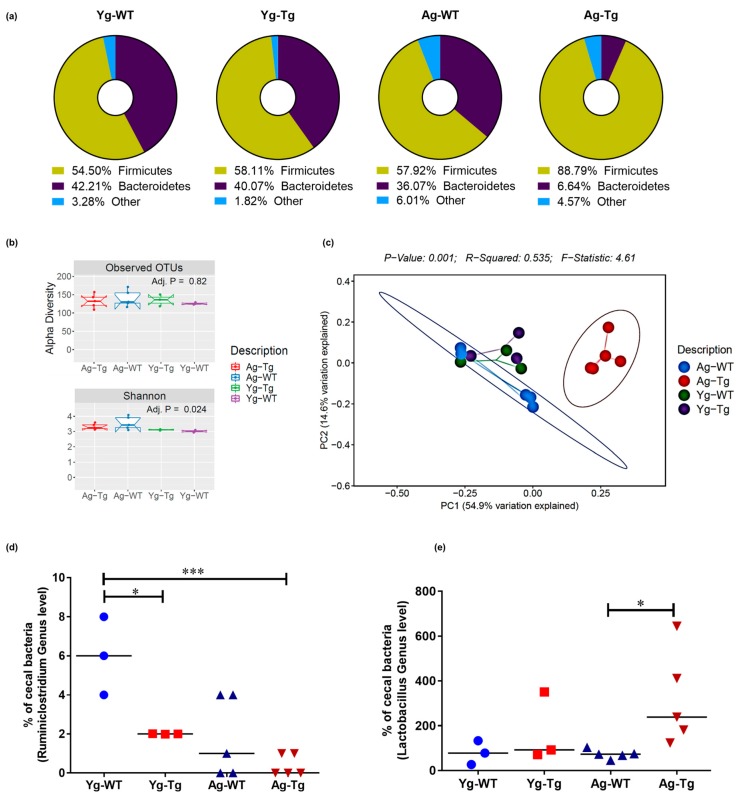
Compositional differences in gut microbiota by 16S rRNA sequencing of intestinal luminal content. (a) Average enrichment of top bacterial phyla of Firmicutes and Bacteroidetes in Tg2576 vs. WT littermate controls by qPCR. (b) Visualization of beta-diversity, or between-sample diversity, with weighted UniFrac distances by principal coordinate analysis (PCoA) shows a clustering effect by strain between Tg2576 and WT littermate controls at 15 months, which is not observed at 6 months. (c) Number of observed Operational Taxonomic Units (OTUs) and the alpha-diversity, or within-sample diversity (Shannon diversity index) when comparing Tg2576 and WT littermate groups. (d) Differences at the genus level show a significantly reduced abundance of Ruminiclostridium in the cecal content of Tg2576 mice starting at 6 months and persisting at 15 months compared to age-matched WT littermate controls. (e) Differences at the genus level show a significant increase in Lactobacillus abundance in Tg2576 mice at 15 months, which was not present at 6 months, when compared to age-matched WT controls. n = 3,5 per group. Data are expressed as mean ± SEM, as well as individual values, and are obtained from >2 independent experiments at various times. * p < 0.05, *** p < 0.001. P values were calculated using Two-Way ANOVA analysis with Sidak’s multiple comparisons correction (d,e).

