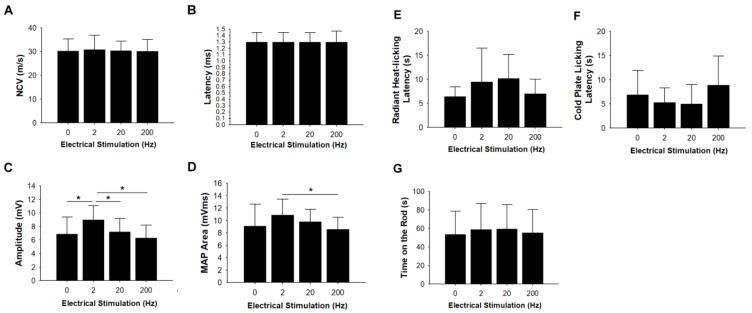
Figure 3.
Analysis of evoked muscle action potentials (MAPs), including (A) nerve conduction velocity (NCV), (B) latency, (C) peak amplitude, and (D) area under the MAP curves. Analysis of electrical stimulation on thermal and motor coordination tests, including (E) radiant heat, (F) cold plate licking latency, and (G) time-on-the rod tests. * Significant differences between conditions, P < 0.05.

