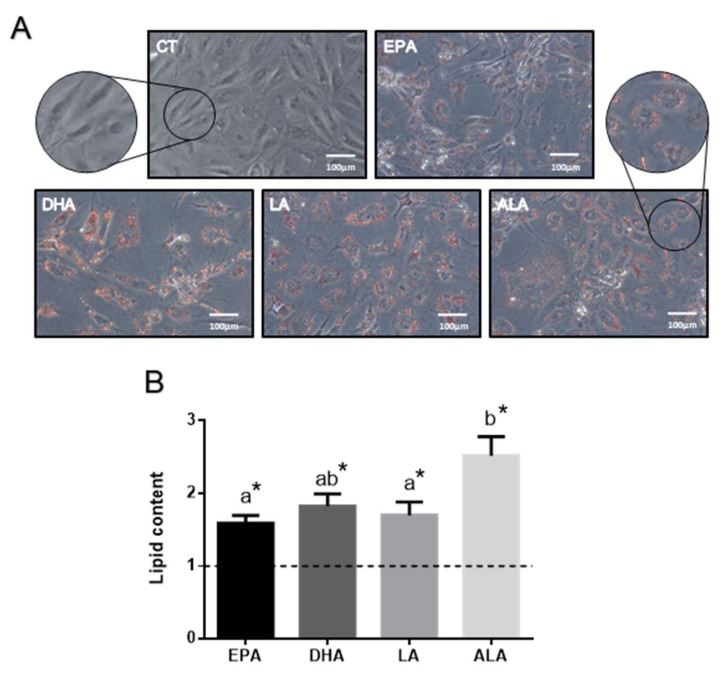
Figure 1.
(A) Representative phase-contrast images (and 2× enlargements) of rainbow trout preadipocyte cells after staining with Oil red O and (B) quantification of lipid content. Cells were treated at day 7 with individual fatty acids (100 µM) or were left untreated as control (dashed line in (B) for 48 h. Data are shown as mean + SEM (n = 4). Significant differences (p < 0.05) with the control are indicated by asterisks (*) and among treatments by different letters (a,b). CT: control; EPA: eicosapentaenoic acid; DHA: docosahexaenoic acid; LA: linoleic acid; ALA: α-linolenic acid.

