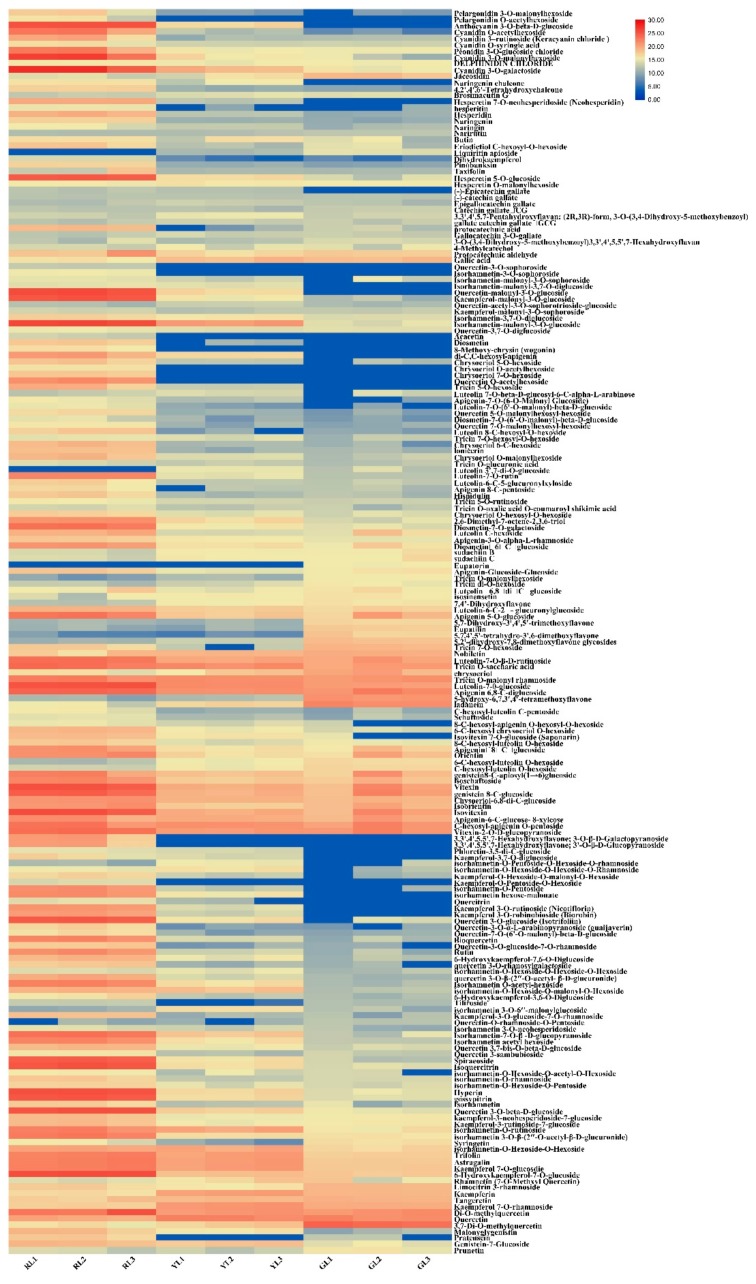
Figure 3.
Hierarchical clustering analysis of all metabolites detected in this study. The abscissa indicates three biological replicates of red leaves (RL1, RL2, and RL3), yellow leaves (YL1, YL2, and YL3) and green leaves (GL1, GL2, and GL3), and the ordinate indicates the metabolites detected in this study. The red segments indicate a relatively high content of metabolites, while the blue segments indicate a relatively low content of metabolites. The relative metabolite contents represented by color segments at the corresponding locations are listed in Table S1.

