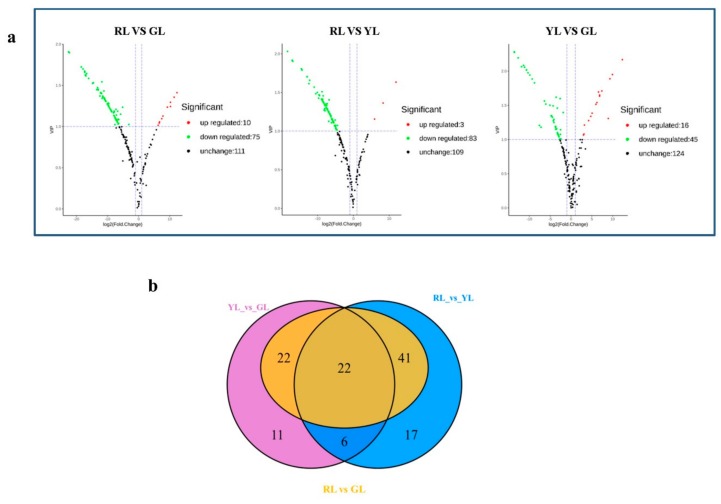
Figure 4.
(a) Volcano plot of differential metabolites for RL vs. GL, RL vs. YL and YL vs. GL. The colors of the scatter points in Figure 4a indicate the final screening results: red indicates metabolites that were significantly up-regulated; green indicates metabolites that were significantly down-regulated; grey indicates metabolites with no significant difference. (b) Venn diagram analysis of differential metabolites. RL, red leaves; YL, yellow leaves; GL, green leaves.

