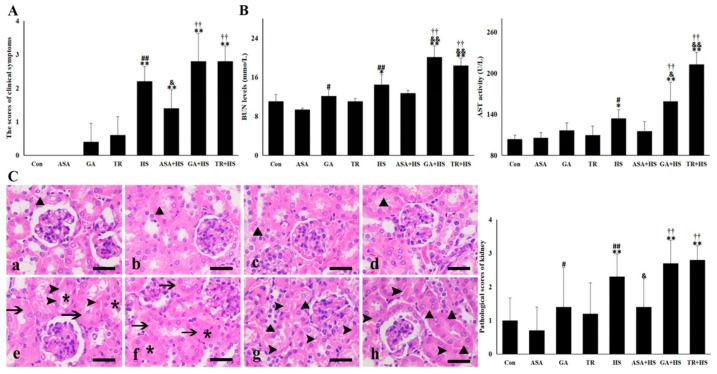
Figure 1.
Kidney damages in the different groups. The data represent the means ± SD. (A) Clinical symptom scores in the different groups. (B) Serum BUN (blood urea nitrogen) and AST (alanine aminotransferase) levels in the different groups. (C) Histopathological observations were conducted under a light microscope. Left: a–h show the morphology of the tested renal tissues in the Con, ASA, GA, TR, HS, ASA+HS, GA+HS, and TR+HS groups, respectively, after hematoxylin eosin (H&E) staining. Bar = 20 µm. Arrows indicate swollen cells, asterisks indicate lumen stenosis or atresia, arrowheads mark necrosis, and black triangles show cellular degeneration. Right: Pathological scores of the different groups. The comparison between the Con group and other groups is indicated by * p < 0.05 and ** p < 0.01, comparison of the ASA group with the GA, TR, and HS groups is indicated by # p < 0.05 and ## P < 0.01, comparison of the HS group with the ASA+HS, GA+HS, and TR+HS groups is indicated by & p < 0.05 and && p < 0.01, and comparison of the ASA+HS group with the GA+HS and TR+HS groups is indicated by † p < 0.05 and †† p < 0.01.

