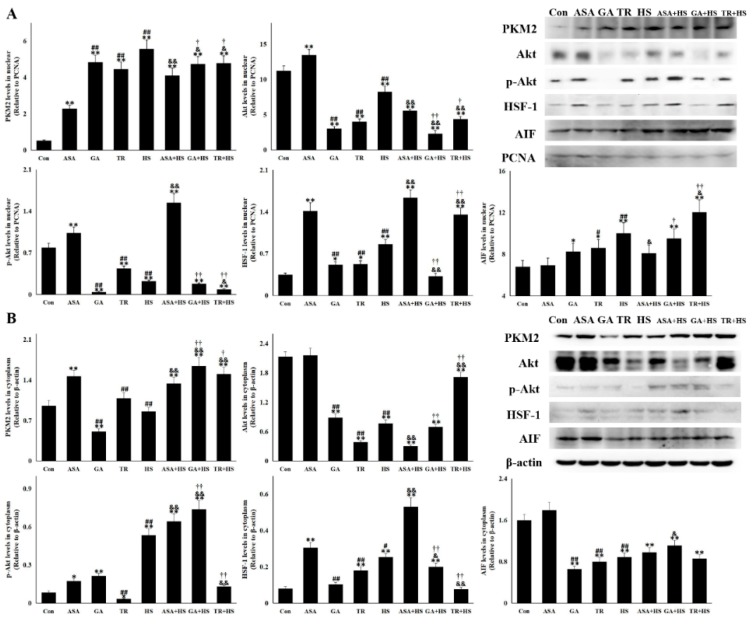
Figure 5.
The nuclear and cytoplasmic levels of vital proteins in the different groups. Western blot analysis was performed with the indicated antibodies. The data represent the means ± SD. (A) Nuclear proteins of renal tissues in all tested groups were extracted and used for semiquantitative detection of the corresponding proteins. The relative abundance of the tested proteins was normalized to that of PCNA (proliferating cell nuclear antigen). (B) Cytoplasmic proteins of renal tissues in all tested groups were extracted and used for semiquantitative detection of the corresponding proteins. The relative abundance of the tested proteins was normalized to that of β-actin. The comparison between the Con group and other groups is indicated by * p < 0.05 and ** p < 0.01, comparison of the ASA group with the GA, TR, and HS groups is indicated by # p < 0.05 and ## p < 0.01, comparison of the HS group with the ASA+HS, GA+HS, and TR+HS groups is indicated by & p < 0.05 and && p < 0.01, and comparison of the ASA+HS group with the GA+HS and TR+HS groups is indicated by † p < 0.05 and †† p < 0.01.

