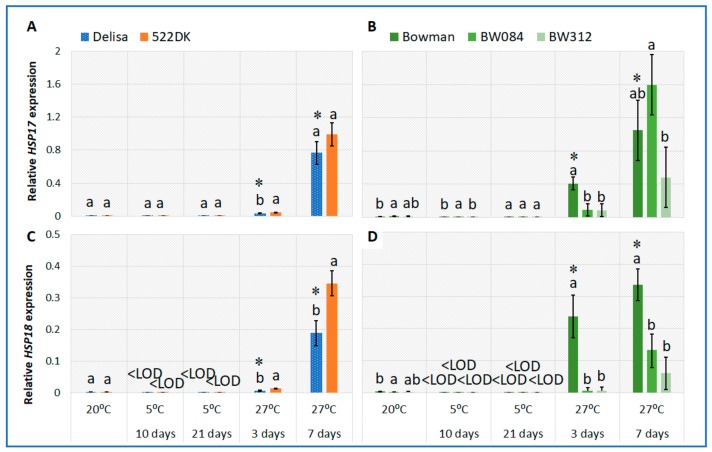
Figure 3.
Relative transcript level of HSP17 and HSP18 in the barley leaves of the cv. Delisa, 522DK mutant (A,C), cv. Bowman, and the BW084 and BW312 (B,D) mutants at 20 °C and during and after acclimation at 5 °C and 27 °C. The transcript levels are presented as the fold change in the expression of a specific gene in the specific samples compared to the reference gene actin. The statistical differences between the cv. Delisa and its mutant 522DK (Student’s t-test, p ≤ 0.05) and between cv. Bowman and its mutants (Duncan’s test, p ≤ 0.05) for each temperature are indicated by different letters. Additionally, the accumulations of the transcript in the Delisa and Bowman cultivars at different temperatures were compared. The comparisons were performed in pairs (for 20 °C and 5 °C; 20 °C and 27 °C) (Student’s t-test, p ≤ 0.05) and the statistical differences are indicated by an asterisk. LOD: below detection limit.

