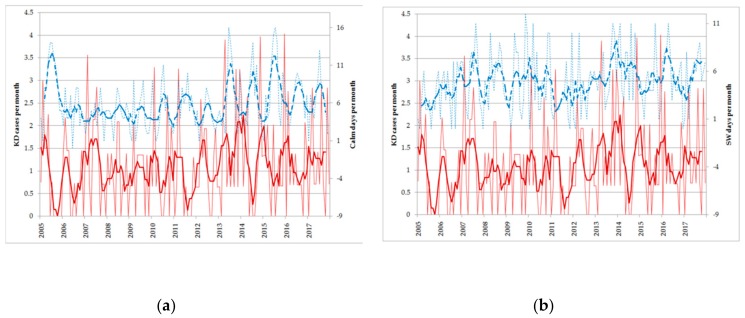
Figure 5.
(a) Number of KD onsets per month as a function of time in Emilia (thin red line, left axis) together with its five month running mean (thick red line), and number of calm days per month in Emilia (thin dashed blue line, right axis) with its five month running mean (thick dashed blue line). (b) Same as panel a but blue lines refer to the number of SW wind per month in Emilia.

