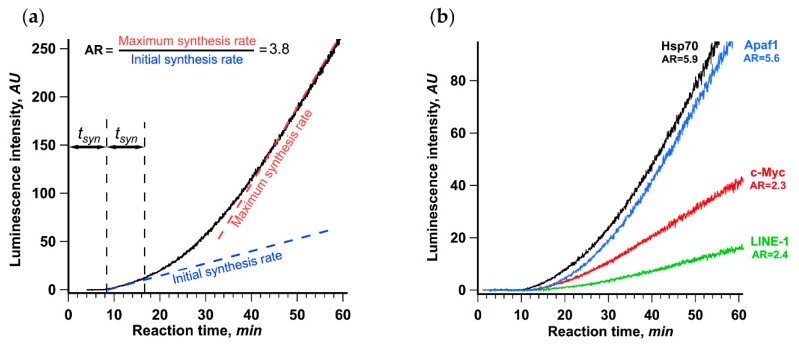
Figure 1.
Rate of protein synthesis increases in the course of translation of capped and polyadenylated mRNA, as revealed by continuous in situ measurement of luminescence. (a) βgloFlucA50 mRNA (25 nM) was translated in a Krebs-2 cell-free translation system at 30 °C. The dashed lines depict the initial synthesis rate as the slope of the linear fit of the data collected during the first 5 min after the appearance of active product and the maximum synthesis rate as the maximum slope of the kinetic curve achieved in the course of translation reaction. The ratio of the maximum and the initial synthesis rates was used as a measure of the translation acceleration (AR, stands for “acceleration rate”). The initial translation rate was determined as a linear approximation of a 5 min fragment of a kinetic curve right after appearance of luciferase activity; maximum translation rate was determined as a maximal value of the slope of linear approximations obtained for a 5 min window sliding along the whole kinetic curve with 2.5 s step. (b) Four Fluc encoding mRNAs with 5′ untranslated regions (UTRs) of different human genes (HSPA1A, 5′ UTR is 219 nt long; MYC, 421 nt; APAF1, 580 nt; and LINE-1, 908 nt) were translated in the same system. In both cases, the representative curves out of at least three replicates are shown.

